 |
|
|
|
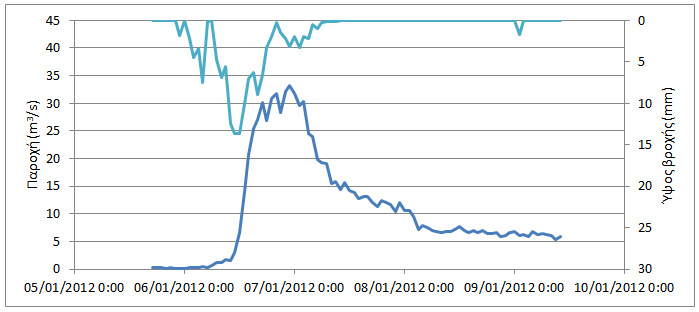
Event N1_2012 (5/1/12 – 9/1/12) Location Latomeio Mpaka
Download the time series as CSV file The rainfall (with a total height of 136.4 mm) starts on 5/1 23:00 and ends on 7/1 10:00 and the peak occurring on 6/1 11:00 (maximum intensity 13.6 mm/h). With a base flow equal with 0.34 m 3 /s, the discharge begins to increase abruptly approximately 8 hours after the rainfall start. Its peak occurs on 6/1 23:00 (33.2 m3/s) following two smaller peaks. After the peaks, the discharge decreases with a decreasing rate until it stabilizes at 5.87 m3/s, approximately 2 days after the observed peak.
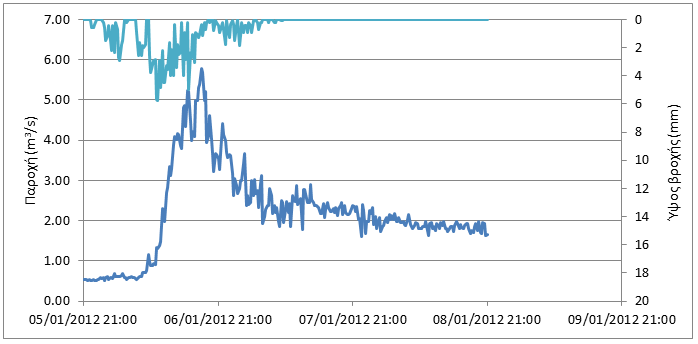
Location Karveliotis
Download the time series as CSV file The rainfall with a total height of 161.7 mm (with rainfall data from Nedousa's station) starts on 5/1 22:15 and ends on 7/1 7:15 with the peak occurring on 6/1 10:15 (maximum intensity 23.1 mm/h). With a base flow equal with 0.53 m3/s, the discharge begins to increase abruptly 8 hours and 30 minutes after the rainfall start. Its peak occurs on 6/1 18:00 (5.77 m3/s). After the peak, the observed discharge decreases exponentially after the recorded peak, with fluctuations due to the rainfall's profile, and stabilizes at 1.65 m3/s, two days after the recorded peak.
|