 |
|
|
|
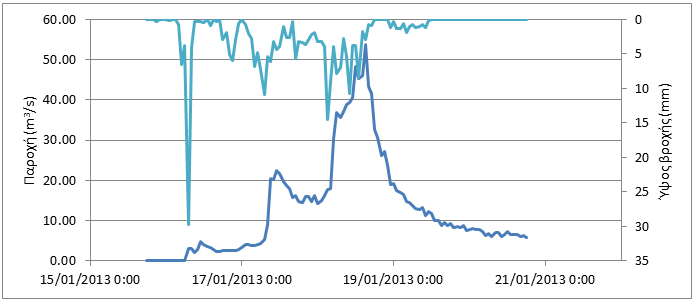
Event N1_2013a (15/1/13 – 20/1/13) Location Latomeio Mpaka
Download the time series as CSV file The rainfall with a total height of 262.9 mm starts at 16/1 1:00 and ends at 19/1 11:00 with the highest peaks occurring at 16/1 7:00 (maximum intensity 29.7 mm/h), at 17/1 7:00 (10.9 mm/h) and at 18/1 3:00 (14.5 mm/h). With a base flow equal with 0.00 m 3 /s, the discharge begins to increase, following the rainfall's profile, reaching its first peak at 17/1 11:00 (22.40 m3/s), its second peak at 18/1 12:00 (48.37 m3/s) and later, its highest value at 18/1 15:00 (53.63 m3/s). Afterwards, it decreases until it stabilizes at 6.00 m3/s two days after the observed discharge peak.
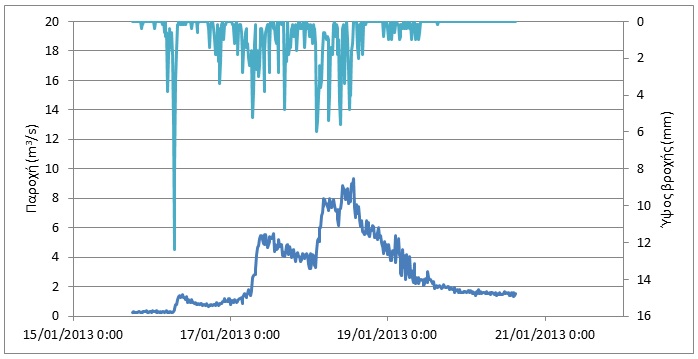
Location Karveliotis
Download the time series as CSV file The rainfall with a total height of 279.0 mm (with rainfall data from Karveliotis' station) starts at 16/1 3:15 and ends at 19/1 10:00 with the highest peaks occurring at 16/1 6:45 (maximum intensity 49.6 mm/h), at 17/1 6:45 (20.8 mm/h) and at 18/1 2:15 (24 mm/h). With a base flow equal with 0.24 m 3 /s, the discharge begins to increase, following the rainfall's profile, reaching its first peak at 17/1 13:00 (5.59 m3/s), its second peak at 18/1 4:45 (7.93 m3/s) and later, its highest value at 18/1 13:30 (9.33 m3/s). Afterwards, it decreases until it stabilizes at 1.50 m3/s two days after the observed discharge peak.
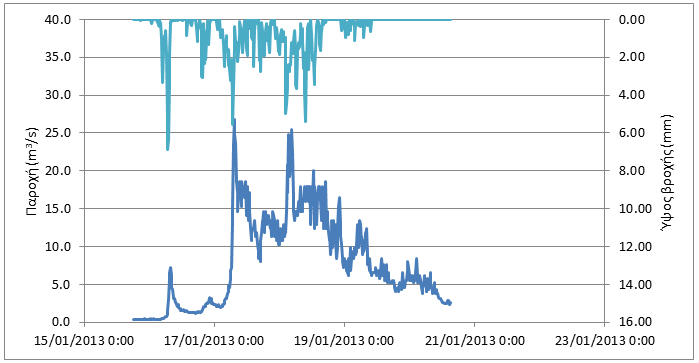
Location Alagonia
Download the time series as CSV file The rainfall with a total height of 272.7 mm (with rainfall data from Karveliotis' and Alagonia's stations) starts at 16/1 2:45 and ends at 19/1 10:30 with the highest peaks occurring at 16/1 7:00 (maximum intensity 27.5 mm/h), at 17/1 6:45 (22.2 mm/h) and at 18/1 9:30 (21.5 mm/h). With a base flow equal with 0.15 m3/s the discharge begins to increase following the rainfall's profile reaching its peak at 17/1 7:15 (25.25 m3/s) and its second highest peak at 18/1 4:30 (23.92 m3/s). After the peaks, the discharge begins to decrease, with some fluctuations due to variations in the rain's intensity, until it stabilizes at 2.11 m3/s.
|