 |
|
|
|
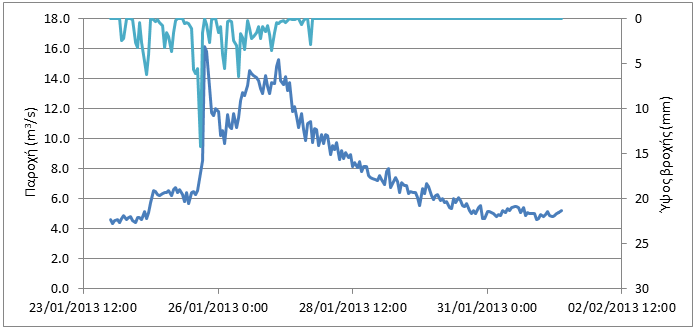
Event N1_2013b (24/1/13 – 1/2/13) Location Latomeio Mpaka
Download the time series as CSV file The rainfall with a total height of 142.0 mm starts on 24/1 5:00 and ends on 27/1 17:00 with the peak occurring on 25/1 16:00 (maximum intensity 14.2 mm/h). With a base flow equal with 4.62 m3/s the discharge begins to increase abruptly reaching its peak on 25/1 18:00 (16.14 m3/s) and a second peak occurring later due to the rain's continuation. Afterwards, the discharge begins to decrease slowly until it stabilizes at 5.23 m3/s.
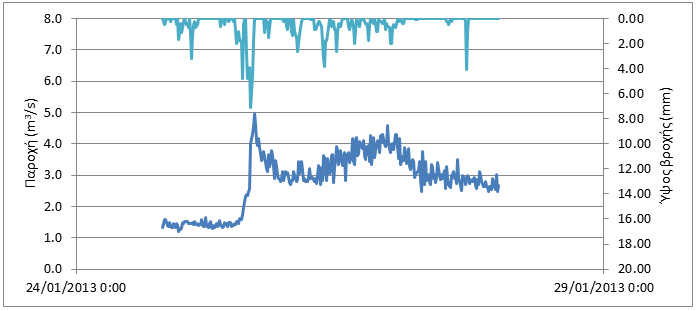
Location Karveliotis
Download the time series as CSV file The rainfall with a total height of 141.0 mm (with rainfall data from Alagonia's station) starts on 24/1 20:00 and ends on 27/1 17:15 with the peak occurring on 25/1 15:45 (maximum intensity 28.4 mm/h). With a base flow equal with 1.34 m3/s the discharge begins to increase abruptly reaching its peak on 25/1 16:30 (4.96 m3/s) and a second peak occurring later due to the rain's continuation. Afterwards, the discharge begins to decrease slowly until it stabilizes at 2.67 m3/s.
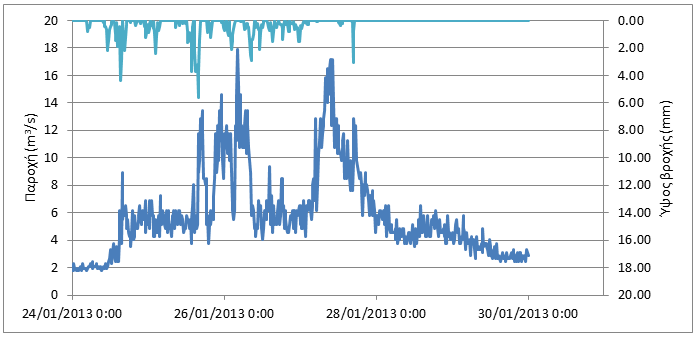
Location Alagonia
Download the time series as CSV file The rainfall with a total height of 143.7 mm (with rainfall data from Alagonia's and Nedousa's stations) starts on 24/1 9:45 and ends on 27/1 17:00 with the highest peaks occurring on 24/1 15:15 (maximum intensity 17.6 mm/h) and on 25/1 15:45 (22.5 mm/h). With a base flow equal with 1.23 m3/s, the discharge begins to increase, approximately 3 hours after the rainfall's start, following the rainfall's profile, with some recorded peaks. The highest peak is recorded on 26/1 4:15 (17.87 m3/s) and later the observed discharge decreases abruptly. Afterwards, a second peak follows due to the rain's continuation and the discharge begins to decrease until it stabilizes at 2.33 m3/s.
|