 |
|
|
|
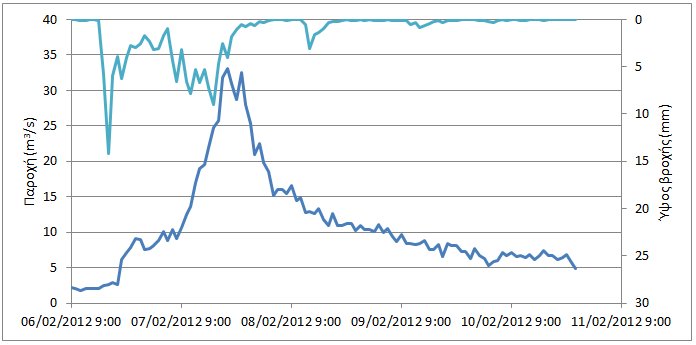
Event N2_2012 (6/2/12 – 10/2/12) Location Latomeio Mpaka
Download the time series as CSV file The rainfall (with a total height of 155.0 mm) starts on 6/2 15:00 and ends on 8/2 5:00 with some small values occurring later and the highest peaks occurring on 6/2 17:00 (maximum intensity 14.2 mm/h) and on 7/2 16:00 (9.04 mm/h). With a base flow equal with 2.21 m3/s, the discharge begins to increase gradually approximately 5 hours after the rainfall start. The discharge profile follows that of the rainfall's and its peak occurs on 7/2 19:00 (33.1 m3/s). After the peak, a smaller peak is recorded and the discharge decreases (with a duration of approximately 2.5 days), with a decreasing rate due to the small or zero rain values, until it stabilizes at 4.83 m3/s.
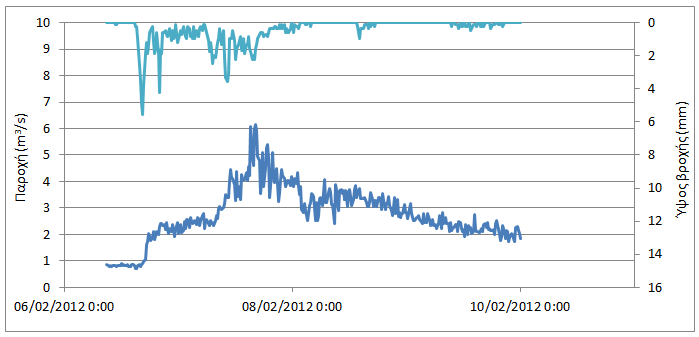
Location Karveliotis
Download the time series as CSV file The rainfall with a total height of 156.7 mm (with rainfall data from Nedousa's station) starts on 6/2 15:00 and ends on 8/2 3:00 with some small values occurring later and the highest peaks occurring on 6/2 16:30 (maximum intensity 22.2 mm/h) and on 7/2 10:15 (14.2 mm/h). With a base flow equal with 0.88 m3/s, the discharge begins to increase approximately 2 hours and 30 minutes after the rainfall start. At the beginning, the discharge remains almost stable for a period of 13 hours however, next, its profile follows that of the rainfall's and its peak occurs on 7/2 16:15 (6.16 m3/s) with some smaller peaks occurring earlier. Afterwards, the discharge decreases slowly (with a duration of 2 days) until it stabilizes at 1.84 m3/s.
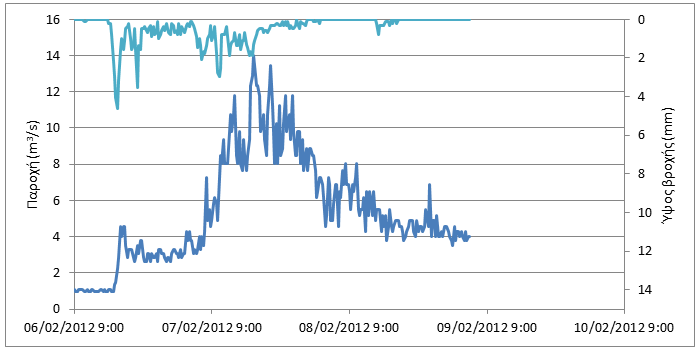
Location Alagonia
Download the time series as CSV file The rainfall with a total height of 126.6 mm (with rainfall data from Nedousa's station) starts on 6/2 15:00 and ends on 8/2 3:00 with some smaller values occurring later and the highest peaks occurring on 6/2 16:30 (maximum intensity 18.5 mm/h) and on 7/2 10:15 (11.8 mm/h). With a base flow equal with 1.10 m3/s, the discharge begins to increase approximately 1 hour and 30 minutes after the rainfall start. At the beginning the discharge remains stable for a period of 13 hours however, next, its profile follows that of the rainfall's and its peak occurs on 7/2 16:15 (14.7 m3/s) with some smaller peaks occurring earlier. Afterwards, the discharge decreases slowly (with a duration of one day) until it stabilizes at 4.03 m3/s.
|