 |
|
|
|
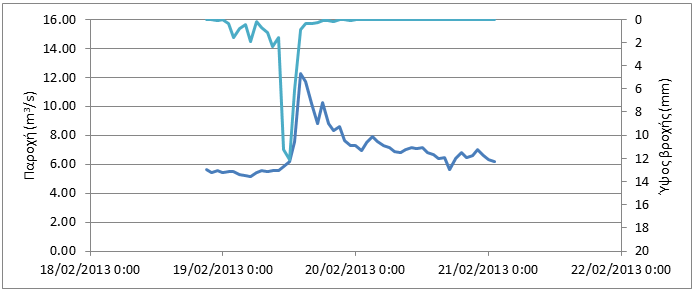
Event N2_2013 (18/2/13 – 20/2/13) Location Latomeio Mpaka
Download the time series as CSV file The rainfall with a total height of 43.3 mm starts on 19/2 1:00 and ends on 19/2 20:00 with the peak occurring on 19/2 12:00 (maximum intensity 12.1 mm/h). With a base flow equal with 5.60 m3/s the discharge increases abruptly until it reaches its first peak (12.3 m3/s) and later its highest peak on 19/2 14:00 (12.3 m3/s). Next, following the rainfall's small values, the observed discharge decreases until it stabilizes at 6.19 m3/s.
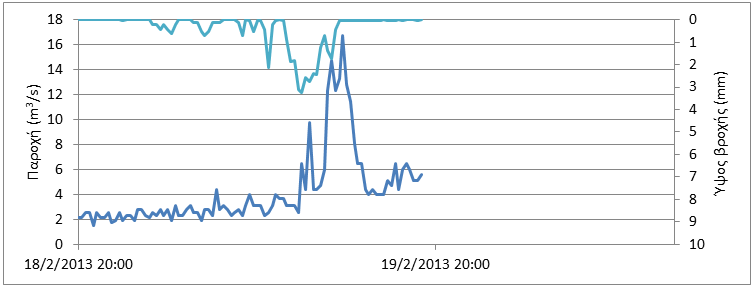
Location Alagonia
Download the time series as CSV file The rainfall with a total height of 35.9 mm (with rainfall data from Alagonia's and Nedousa's stations) starts on 19/2 0:15 and ends on 19/2 13:30 with the peak occurring on 19/2 11:30 (maximum intensity 11.1 mm/h). With a base flow equal with 2.11 m3/s the discharge increases abruptly until it reaches its first peak (9.79 m3/s) and later its highest peak on 19/2 13:45 (16.77 m3/s). Next, following the rainfall's halt, the observed discharge decreases abruptly until it stabilizes at 5.56 m3/s.
|