 |
|
|
|
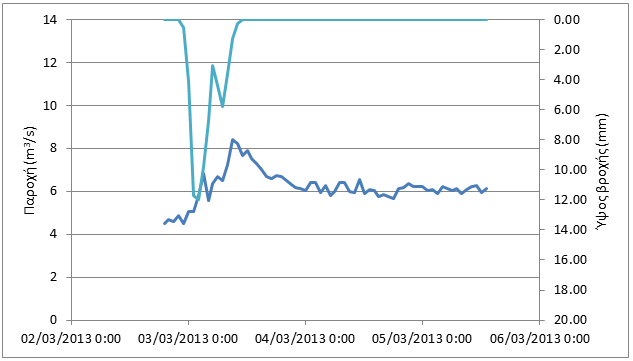
Event N3_2013 (2/3/13 – 3/3/13) Location Latomeio Mpaka
Download the time series as CSV file The rainfall with a total height of 63.2 mm starts on 2/3 23:00 and ends on 3/3 10:00 with the peak occurring on 3/3 2:00 (maximum intensity 12.0 mm/h). With a base flow equal with 4.48 m3/s, the discharge increases right after the rainfall's start, following its profile. The discharge reaches its peak on 3/3 9:00 (8.41 m3/s) with some smaller peaks occurring earlier. Next, following the rainfall's halt, the observed discharge decreases until it stabilizes at 6.12 m3/s.
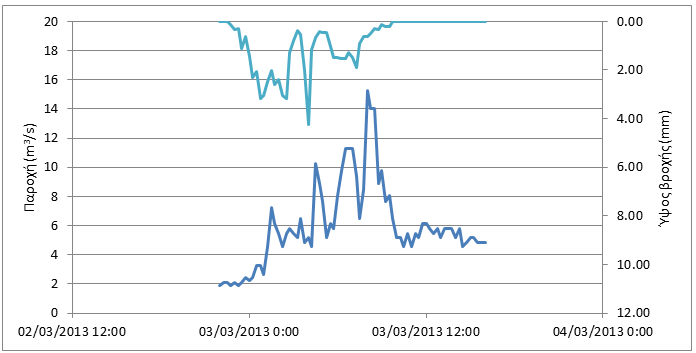
Location Alagonia
Download the time series as CSV file The rainfall with a total height of 58.1 mm (with rainfall data from Alagonia's and Nedousa's stations) starts on 2/3 22:45 and ends on 3/3 9:45 with the peak occurring on 3/3 4:00 (maximum intensity 17.0 mm/h). With a base flow equal with 1.38 m3/s, the discharge increases right after the rainfall's start, following its profile. The discharge reaches its peak on 3/3 8:00 (15.72 m3/s) with some smaller peaks occurring earlier. Next, following the rainfall's halt, the observed discharge decreases abruptly until it stabilizes at 4.74 m3/s.
|