 |
|
|
|
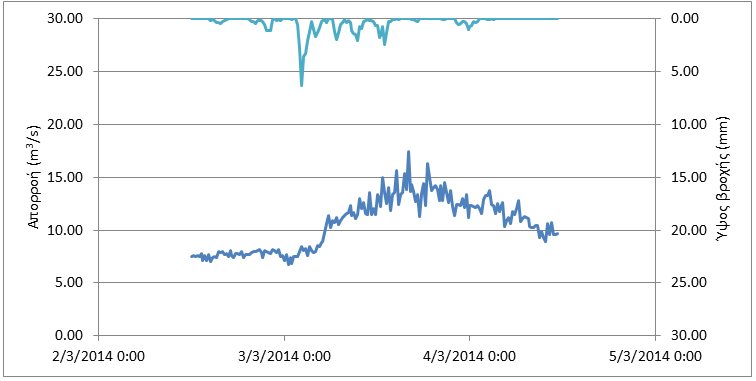
Event N3_2014 (2/3/14 – 15/3/14) Location Latomeio Mpaka
Download the time series as CSV file The rainfall (with a total height of 66.1 mm) starts on 2/3 18:00 and ends on 4/3 1:30 with its peak occurring on 3/3 16:00 (maximum intensity 25.1 mm/h). With a base flow equal with 7.49 m 3 /s, the discharge begins to increase gradually and slowly, 7 hours after the rainfall start, until it reaches its peak on 3/3 16:00 (17.43 m3/s). After the peak, the discharge decreases slowly (with a duration of 1 day) until it stabilizes at 9.66 m3/s.
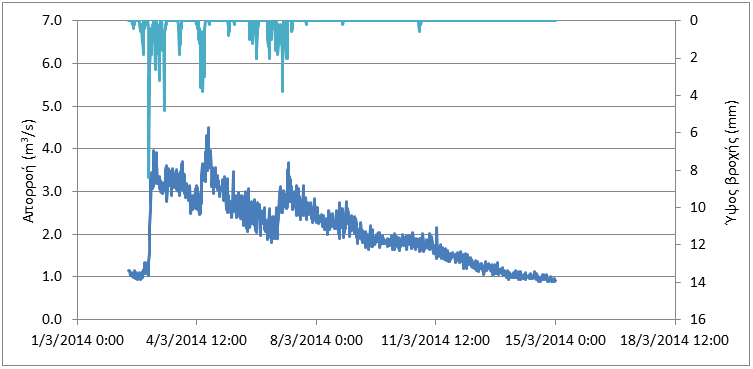
Location Karveliotis
Download the time series as CSV file The rainfall with a total height of 159.6 mm (with rainfall data from Karveliotis' station) starts on 2/3 15:15 and ends on 7/3 7:30 with the two highest peaks occurring on 3/3 2:15 (maximum intensity 33.6 mm/h) and on 3/3 13:00 (19.2 mm/h). With a base flow equal with 1.15 m3/s, the discharge begins to increase abruptly after the rainfall start reaching its first peak and later follows the rainfall's profile up until its highest peak on 4/3 20:00 (4.50 m3/s). After the peak, the discharge decreases exponentially, with another smaller peak occurring later, until it stabilizes at 0.89 m3/s.
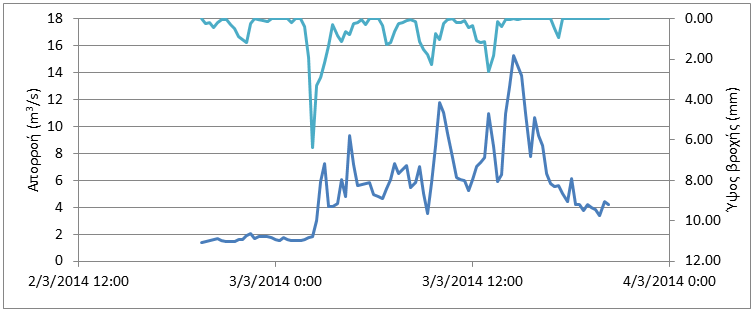
Location Alagonia
Download the time series as CSV file The rainfall with a total height of 52.6 mm (with rainfall data from Alagonia's, Nedousa's and Karveliotis' station) starts on 2/3 19:30 and ends on 3/3 17:30 with the two highest peaks occurring on 3/3 2:15 (maximum intensity 25.5 mm/h) and on 3/3 13:30 (10.4 mm/h). With a base flow equal with 1.40 m3/s, the discharge begins to increase abruptly after the rainfall start, with a lot of fluctuations, following the rainfall's complex profile. It reaches its peak on 3/3 14:30 ( 15.3 m3/s) and starts to decrease until it stabilizes at 4.19 m3/s.
|