 |
|
|
|
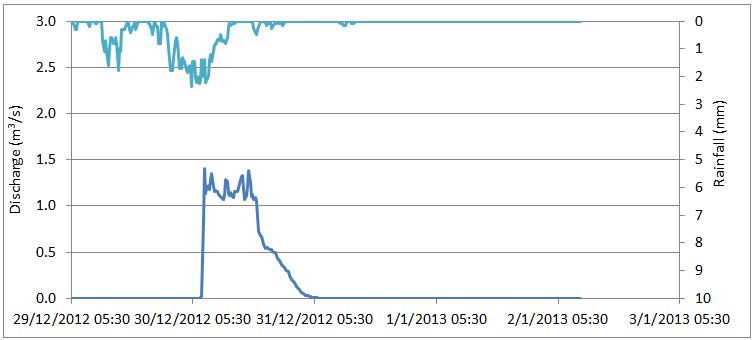
Event 5, 29/12/12 – 2/1/13 Location Oinoi
Download the time series as CSV file The rainfall with a total height of 93.1 mm starts on 29/12 5:45 and ends on 30/12 23:30 with the biggest volumes falling in two time periods, from 29/12 11:45 to 29/12 18:30 and from 30/12 0:00 to 30/12 13:45 and its peak occurring on 30/12 5:15 (maximum intensity 9.4 mm/h). The discharge begins 25 hours and 15 minutes after the rainfall's start, on 30/12 7:00, where it increases abruptly from 0 m3/s to 1.40 m3/s, which is the peak discharge (30/12 07:45). After its peak, the discharge fluctuates between 1.0 and 1.5 m3/s until 30/12 18:00 where it decreases abruptly, and from 30/12 19:45 continues to decrease less steeply until it reaches its zero value on 31/12 06:45.
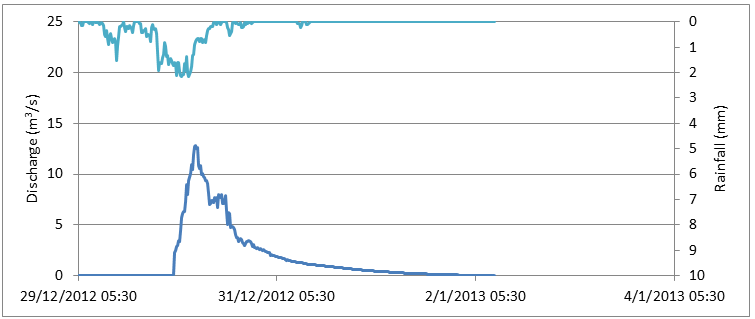
Location Gyra Stefanis
Download the time series as CSV file The rainfall (total height of 94.5 mm) starts on 29/12 5:45 and ends on 30/12 23:00 with its peaks occurring on 30/12 6:30 (maximum intensity 8.64 mm/h). The discharge begins 22 hours and 30 minutes after the rainfall's start, on 30/12 4:15, with a steep rising branch, and reaches its peak (12.78 m3/s) on 30/12 09:45. Next a slow discharge is observed, exceeding by much the time of concentration, until it reaches zero (2/1 7:45).
|