 |
|
|
|
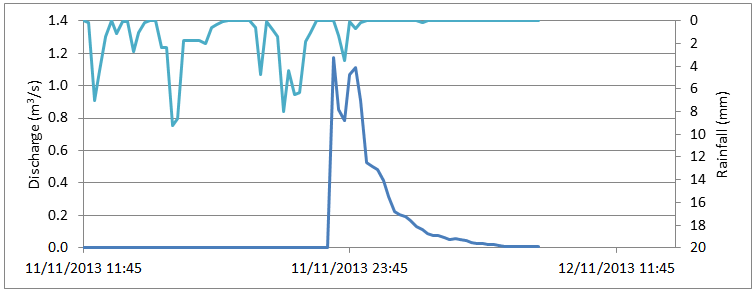
Event 8, 11/11/13 – 12/11/13 Location Oinoi
Download the time series as CSV file The rainfall (with a total height of 92.2 mm) starts on 11/11 12:00 and ends on 12/11 0:15 and the peaks occur on 11/11 12:15 (maximum intensity 28.0 mm/h), on 11/11 15:45 (36.8 mm/h) and on 11/11 20:45 (32.0 mm/h). The discharge begins abruptly 11 hours after the rainfall's start until its peak (1.17 m3/s on 11/11 23:00). After its peak, a second smaller peak is observed (1.11 m3/s) and the discharge starts to descend, due to the rainfall's halt, until it reaches its zero value (12/11 8:00).
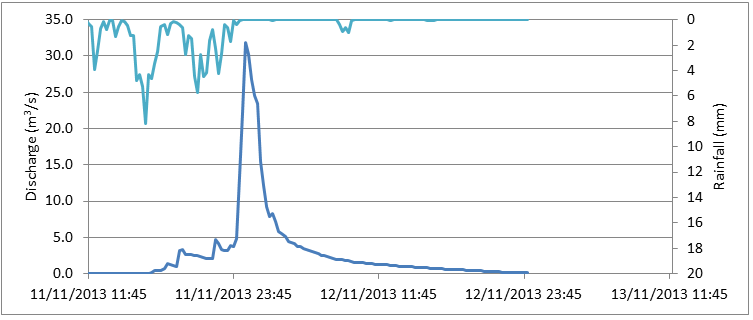
Location Gyra Stefanis
Download the time series as CSV file The rainfall (total height of 100.9 mm) starts on 11/11 12:00 and ends on 12/11 0:15 and its peaks occur on 11/11 16:30 (maximum intensity 32.8 mm/h) and on 11/11 20:45 (23.0 mm/h). The discharge begins 5 hours after the rainfall's start and increases until its peak (31.83 m3/s on 12/11 0:45). Next, it decreases abruptly, due to the rainfall's halt, until it reaches its zero value (13/11 0:00).
|