 |
|
|
|
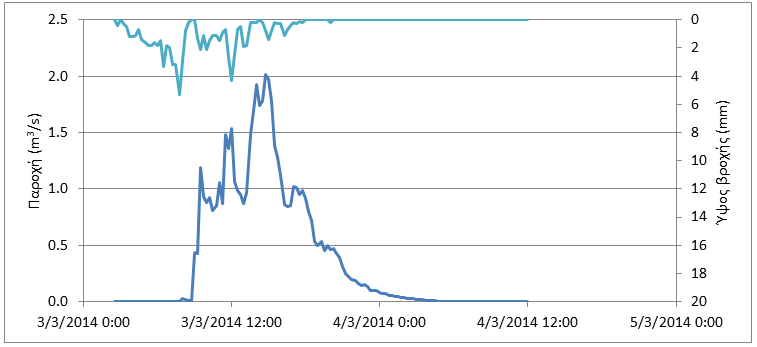
Event 12, 1/3/14 – 13/3/14 Location Oinoi
Download the time series as CSV file The rainfall (with a total height of 75.2 mm) starts on 3/3 2:30 and ends on 3/3 18:00 and the peaks occur on 3/3 7:45 (maximum intensity 21.2 mm/h) and on 3/3 12:00 (17.2 mm/h). The discharge begins abruptly 6 hours after the rainfall's start. It reaches its peak on 3/3 14:45 (2.01 m3/s), following two smaller peaks. Next, the discharge starts to descend exponentially until it reaches its zero value (4/3 5:00), following a smaller peak.
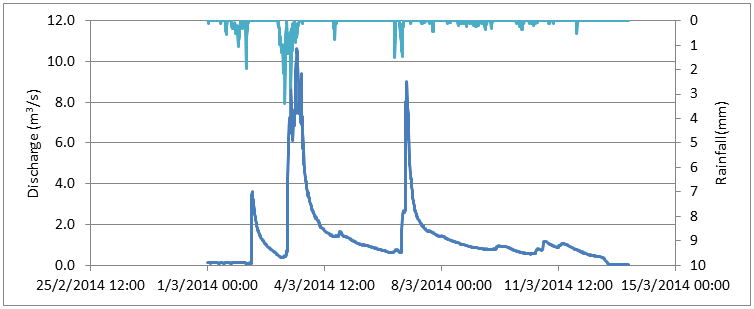
Location Gyra Stefanis
Download the time series as CSV file The rainfall (with a total height of 90.7 mm) starts on 1/3 9:30 and ends on 12/3 2:00, falling in three time periods with the peaks occurring on 3/3 7:45 (maximum intensity 13.5 mm/h) and on 3/3 12:00 (10.8 mm/h). The discharge begins abruptly 5 hours after the rainfall's start, reaching a peak and descending exponentially. Due to the second rainfall episode, it increases steeply reaching its highest peak on 3/3 16:15 ( 10.65 m3/s). Next, the discharge deceases exponentially but due to the last rainfall episode increases again up to 9.01 m3/s. After the last peak, it decreases until it reaches its zero value (12/3 23:15).
|